In the world of data analysis and statistical research, understanding relationships between categorical variables is essential. Whether you’re working in market research, healthcare, education, or machine learning, one statistical method consistently stands out — the Chi Square Test.
This test helps you determine whether observed differences in data are due to chance or indicate a real relationship. It’s one of the most widely used statistical tools for hypothesis testing in categorical data analysis.
What is the Chi Square Test?
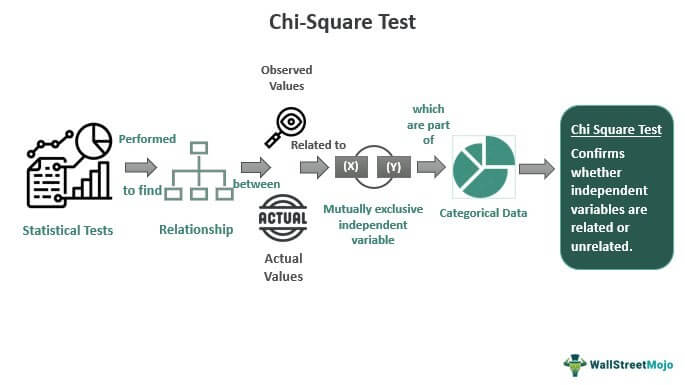
The Chi Square Test is a statistical test that measures the association between two categorical variables. It compares the observed frequencies in a dataset to the expected frequencies that would occur if there were no relationship between the variables.

In simple terms, it answers the question:
“Are these variables independent, or is there a statistically significant relationship between them?”
Why the Chi Square Test Matters in Data Analysis
- Identifies patterns in categorical data
- Validates hypotheses about relationships
- Widely applicable in various domains such as marketing, genetics, and machine learning
- Supports decision-making with statistical evidence
For instance, a company might use it to check whether customer satisfaction is related to product category.
Types of Chi Square Tests
1. Chi Square Test of Independence
- Purpose: To determine if there is a significant relationship between two categorical variables.
- Example: A retail store wants to know if payment method (cash, credit, online) is related to purchase category (electronics, clothing, groceries).
- When to Use:
- Both variables are categorical
- You have a contingency table of frequencies
- You want to check association or dependence
- Both variables are categorical
2. Chi Square Goodness of Fit Test
- Purpose: To check if an observed frequency distribution matches an expected distribution.
- Example: A dice manufacturer wants to see if their dice are fair by comparing the observed roll outcomes to the expected equal probabilities for each face.
- When to Use:
- You have one categorical variable
- You know the theoretical distribution to compare against
- You have one categorical variable
3. Yates’ Correction for Continuity
- Purpose: A correction applied to the Chi Square Test of Independence for 2×2 contingency tables to make the test more conservative.
- Example: Testing whether a training program (attended/not attended) affects pass rates (pass/fail) in a small dataset.
- When to Use:
- Small sample size
- 2×2 tables
- To reduce overestimation of significance
- Small sample size
4. McNemar’s Chi Square Test
- Purpose: Used for paired nominal data to assess changes before and after a treatment or intervention.
- Example: Checking if a new advertisement changes customer preference (brand A vs. brand B) before and after viewing it.
- When to Use:
- Paired categorical data
- Pre-test and post-test designs
- Paired categorical data
5. Chi Square Test for Homogeneity
- Purpose: To determine if two or more populations have the same distribution of a categorical variable.
- Example: Comparing favorite smartphone brand distributions between customers in India, USA, and UK.
- When to Use:
- Multiple independent samples
- One categorical variable
- Multiple independent samples
6. Likelihood Ratio Chi Square Test
- Purpose: An alternative to the Pearson Chi Square Test, often used when expected frequencies are small.
- Example: In genetics, testing if observed gene frequencies differ from expected ratios in small populations.
- When to Use:
- Small expected frequencies
- Preference for likelihood-based approaches
- Small expected frequencies
7. Mantel-Haenszel Chi Square Test
- Purpose: Used for stratified categorical data to test the association between two variables while controlling for a third variable.
- Example: Studying the relationship between smoking and lung disease while controlling for age group.
- When to Use:
- Categorical data in stratified layers
- Control for confounding variables
- Categorical data in stratified layers
Key Concepts and Terms
- Observed Frequency (O) – Actual count from data
- Expected Frequency (E) – Count you would expect if there’s no relationship
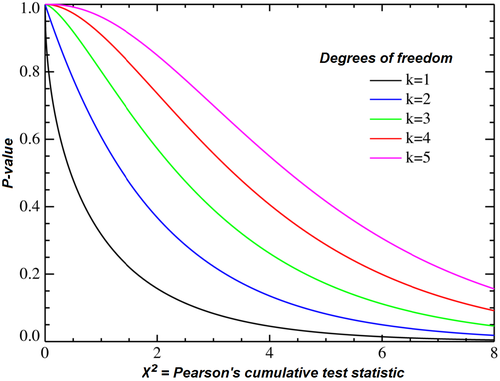
- Degrees of Freedom (df) – Indicates how many values can vary independently
- P-Value – Probability of obtaining observed results assuming the null hypothesis is true
How the Chi Square Test Works
The process involves:
- Stating the null hypothesis (H₀) — No relationship exists between variables
- Collecting and organizing data in a contingency table
- Calculating expected frequencies
- Applying the Chi Square formula
- Comparing the calculated value with the critical Chi Square value from statistical tables
Formula and Calculation Steps
The Chi Square formula is:

Where:
- OOO = Observed frequency
- EEE = Expected frequency
Steps:
- Create a contingency table
- Calculate expected values
- Apply the formula
- Find degrees of freedom:
df=(rows−1)×(columns−1) - Compare to Chi Square table value
Assumptions of the Chi Square Test
- Data must be categorical
- Observations should be independent
- Expected frequency in each cell should be at least 5 (for validity)
Real-World Examples of Chi Square Test Applications

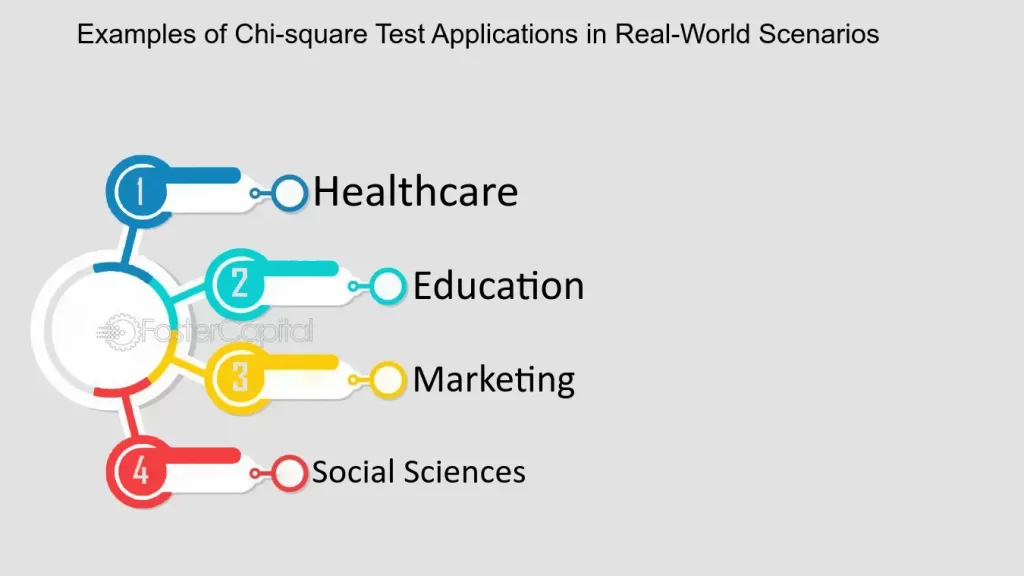
- Marketing – Examining if purchase decisions vary by age group
- Healthcare – Checking if recovery rates differ between treatment methods
- Education – Testing if student performance is linked to teaching methods
- E-commerce – Analyzing if product return rates differ by payment method
Chi Square Test in Data Science and Machine Learning
In ML, the Chi Square Test is often used for feature selection in classification problems:
- Identifying relevant categorical features
- Filtering out unimportant features before training
- Improving model accuracy and efficiency
For example, in predicting whether a customer will buy a product, a Chi Square Test can determine if gender or region significantly affects buying behavior.
Step-by-Step Example with Calculation
Imagine a survey on coffee preference by gender:
| Coffee | Tea | Total | |
| Male | 40 | 20 | 60 |
| Female | 30 | 50 | 80 |
| Total | 70 | 70 | 140 |
Step 1: Calculate expected frequency:

Step 2: Apply formula for all cells and sum results.
Step 3: Compare with Chi Square critical value for df = (2-1)(2-1) = 1.
Interpreting Chi Square Results
- If p<0.05p < 0.05p<0.05: Reject null hypothesis → There is a significant relationship
- If p≥0.05p \geq 0.05p≥0.05: Fail to reject null hypothesis → No significant relationship
Common Mistakes to Avoid
- Using Chi Square for continuous data without converting to categories
- Ignoring low expected frequencies
- Misinterpreting correlation as causation
External Tools and Resources for Chi Square Test
- Online Chi Square Calculators – e.g., GraphPad QuickCalcs
- Python Libraries –
scipy.stats.chi2_contingency() - R Language Functions –
chisq.test()
Conclusion
The Chi Square Test is a cornerstone of categorical data analysis, enabling researchers and analysts to uncover relationships and patterns backed by statistical evidence. From marketing campaigns to medical studies, its versatility makes it a must-have tool for data-driven decision-making.


