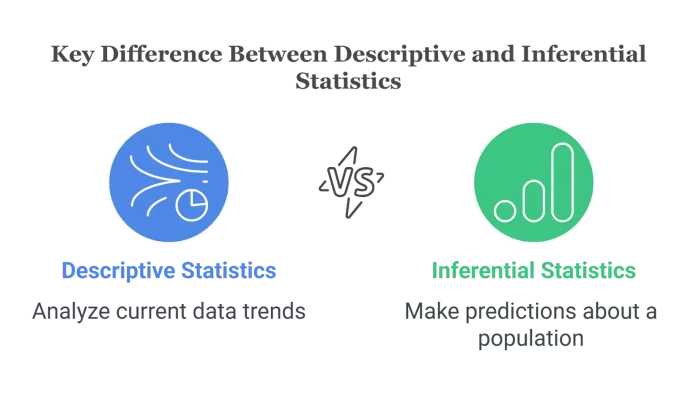
In the world of data analysis, two fundamental branches of statistics—descriptive statistics vs inferential statistics—play crucial roles in interpreting and understanding information. While descriptive statistics summarize raw data into understandable forms like averages, charts, and graphs, inferential statistics go further, helping us make predictions and test hypotheses beyond the immediate dataset.
Both approaches are vital for businesses, researchers, and data scientists who want to extract value from data. To truly master data-driven decision-making, it’s essential to understand not only their definitions but also their differences, use cases, and limitations.

What Are Descriptive Statistics?
Definition and Purpose
Descriptive statistics are methods used to summarize and describe data in a meaningful way. They provide a snapshot of the dataset without making predictions or generalizations.
It answers questions like:
- What is the average age of participants in a survey?
- What percentage of sales occurred in a given region?
- How spread out are students’ test scores?
Types of Descriptive Statistics
Descriptive statistics are generally divided into:
Measures of Central Tendency
- Mean (average)
- Median (middle value)
- Mode (most frequent value)
Measures of Dispersion
- Range
- Variance
- Standard Deviation
- Interquartile Range
Data Distribution and Visualization
- Histograms
- Bar charts
- Pie charts
- Frequency tables
Real-Time Example
A retail company analyzing the average transaction value across thousands of sales uses descriptive statistics. For instance, if the mean purchase value is $50 and the standard deviation is $15, the company quickly learns not only what the typical customer spends but also how varied those spending habits are.
What Are Inferential Statistics?
Definition and Purpose
Inferential statistics involve drawing conclusions and making predictions about a population based on a sample of data. Unlike descriptive statistics, which only describe the data at hand, inferential statistics generalize findings and test hypotheses.
It answers questions like:
- Will a new marketing campaign increase customer engagement?
- What is the probability that a new drug is more effective than an existing one?
- Can we predict next year’s sales from this year’s data?
Key Techniques in Inferential Statistics
Estimation
- Point estimates (e.g., sample mean as an estimate of population mean)
- Confidence intervals
Hypothesis Testing
- Null and alternative hypotheses
- p-values
- t-tests, ANOVA, chi-square tests
Regression Analysis
- Linear regression
- Logistic regression
Correlation Analysis
- Pearson correlation coefficient
- Spearman’s rank correlation
Real-Time Example
Suppose a pharmaceutical company tests a new vaccine on 1,000 volunteers. Using inferential statistics, they can estimate the vaccine’s effectiveness across the entire population, even though only a sample was studied.
Descriptive Statistics vs Inferential Statistics: Key Differences
| Aspect | Descriptive Statistics | Inferential Statistics |
| Definition | Summarizes and describes data | Makes predictions or inferences from data |
| Focus | Raw data presentation | Generalization beyond data |
| Techniques | Mean, median, mode, charts | Hypothesis testing, regression, confidence intervals |
| Output | Simple summaries | Conclusions and probabilities |
| Use Case | Understand current dataset | Predict future outcomes |
When to Use Descriptive Statistics
- To summarize customer demographics in a survey.
- To report quarterly sales numbers.
- To describe patterns in website traffic.
When to Use Inferential Statistics
- To predict election results from a sample poll.
- To estimate national health statistics from regional data.
- To determine whether a new teaching method improves student performance.
Advantages of Descriptive Statistics
- Simple to compute and interpret.
- Provides clear snapshots of large datasets.
- Useful for reporting and dashboards.
Advantages of Inferential Statistics
- Enables predictions beyond the sample.
- Helps validate hypotheses scientifically.
- Guides decision-making in uncertain situations.
Limitations of Descriptive Statistics
- Cannot generalize beyond the dataset.
- Lacks predictive power.
- Can be misleading if data is skewed.
Limitations of Inferential Statistics
- Relies heavily on assumptions (normality, independence).
- Risk of sampling errors.
- Misinterpretation of p-values is common.
Applications in Real Life
- Business: Descriptive statistics summarize past sales, while inferential statistics forecast future demand.
- Healthcare: Descriptive statistics show patient demographics; inferential statistics test treatment outcomes.
- Education: Descriptive statistics highlight exam score averages; inferential statistics compare teaching methods.
Descriptive and Inferential Statistics in Machine Learning
Machine learning often begins with descriptive analysis (exploring data) before applying inferential techniques like regression, hypothesis testing, and probabilistic modeling. Both are essential for building accurate and generalizable models.
Combining Descriptive and Inferential Approaches
In practice, data scientists rarely choose one over the other. A project often begins with descriptive analysis for data understanding, followed by inferential methods for decision-making and predictions.
External Tools and Libraries
- Python: NumPy, Pandas, SciPy, Statsmodels
- R: dplyr, ggplot2, caret
- Excel: Pivot tables, data analysis add-ins
Advanced Layers of Descriptive vs Inferential Statistics
High-Dimensional Statistics
In many modern applications (genomics, finance, NLP), datasets have more features (p) than observations (n).
- Descriptive statistics alone (mean, variance) often fail because of the curse of dimensionality.
- Inferential approaches adapt using regularization methods (e.g., LASSO, Ridge regression).
Robust Statistics
Traditional descriptive and inferential methods are sensitive to outliers.
- Median Absolute Deviation (MAD): A robust alternative to variance.
- Trimmed Mean: Excludes extreme values before computing averages.
- Robust Regression: Down-weights the influence of outliers.
Time Series Perspective
When working with time-dependent data, descriptive and inferential statistics take unique forms:
- Descriptive: Autocorrelation plots, moving averages, volatility clustering.
- Inferential: Hypothesis testing for stationarity (ADF test), ARIMA parameter significance, forecasting intervals.
Advanced Hypothesis Testing
Inferential statistics has evolved beyond basic t-tests and chi-square:
- Permutation Tests: Randomly shuffle data to evaluate statistical significance without distribution assumptions.
- False Discovery Rate (FDR): Corrects for multiple hypothesis testing in large-scale experiments.
- Sequential Testing: Allows decisions in real-time data streams without waiting for the entire dataset.
Bayesian Hierarchical Modeling
A highly advanced inferential approach where parameters themselves have distributions.
- Hierarchical Models: Handle multi-level structured data (e.g., patients nested within hospitals).
- Shrinkage Effects: Estimates are “pulled” toward global averages, improving reliability.
Simulation-Based Inference
With modern computing, simulation replaces closed-form inference:
- Monte Carlo Simulations: Generate thousands of possible outcomes to estimate uncertainty.
- Markov Chain Monte Carlo (MCMC): Used in Bayesian inference to approximate posterior distributions.
Information-Theoretic Approaches
Moving beyond p-values, inference can be based on information criteria:
- AIC (Akaike Information Criterion) and BIC (Bayesian Information Criterion): Balance model fit and complexity.
- Provides a more nuanced model selection method compared to simple hypothesis tests.
Causal Inference vs Predictive Inference
Traditional inferential statistics often focus on association, not causation. Modern approaches separate:
- Predictive Inference: Focused on future outcomes (e.g., predicting customer churn).
- Causal Inference: Uses tools like propensity score matching or instrumental variables to test cause-effect.
Integration with Machine Learning & AI
In practice, data science blends descriptive and inferential statistics:
- Descriptive: Used in Exploratory Data Analysis (EDA) to summarize datasets before modeling.
- Inferential: Underpins model validation techniques like cross-validation and confidence intervals for model accuracy.
Modern Visualization with Inference
Descriptive summaries + inferential uncertainty are now visualized together:
- Confidence Bands: Line plots with shaded uncertainty intervals.
- Bootstrapped Violin Plots: Show both distributions and inferential uncertainty.
- Interactive Dashboards: Blend descriptive and inferential outputs in real-time (e.g., Tableau, Plotly).
Ethical Challenges in Statistics
- Descriptive Statistics Bias: Means and medians can hide disparities (e.g., reporting only average salaries without gender breakdown).
- Inferential Misuse: P-hacking and selective reporting distort conclusions.
- Transparency Standards: Journals now require effect sizes, confidence intervals, and open data/code for reproducibility.
Advanced Concepts in Descriptive and Inferential Statistics
Multivariate Descriptive Statistics
Most introductory descriptive statistics focus on one variable at a time. However, in real-world data science, relationships among multiple variables matter.
- Covariance: Measures the direction of the relationship between two variables.
- Correlation Matrix: Expands correlation analysis to multiple variables, allowing analysts to see interdependencies.
- Principal Component Analysis (PCA): While often seen as machine learning, it starts as a descriptive method to reduce dimensionality and visualize high-dimensional datasets.
Example: A financial analyst may use PCA to reduce hundreds of stock price indicators into fewer key components that describe overall market behavior.
Inferential Statistics and Bayesian Inference
While classical inference relies on frequentist approaches (p-values, hypothesis tests), Bayesian inference is becoming increasingly popular.
- Frequentist Approach: Probability is based on long-run frequencies of events.
- Bayesian Approach: Probability represents belief or certainty, updated as new evidence appears.
Real-Time Example: In spam email detection, Bayesian updating continuously refines the probability of an email being spam as more labeled data arrives.
Effect Size and Practical Significance
Inferential statistics often focus too much on p-values. But in advanced applications, effect size is equally important.
- Cohen’s d: Standardized measure of difference between two means.
- Eta squared: Used in ANOVA to measure variance explained by an independent variable.
Insight: A result may be statistically significant but practically irrelevant. For example, if a new drug improves patient recovery by 0.1%, it may pass significance tests with large samples but hold little clinical value.
Bootstrapping and Resampling Techniques
Advanced inferential analysis frequently uses bootstrapping when data distribution assumptions are weak.
- Resampling involves repeatedly sampling from data with replacement to estimate variability.
- Provides robust confidence intervals without strong parametric assumptions.
Example: In customer satisfaction surveys, bootstrapping helps estimate the confidence interval for average ratings even when the data isn’t normally distributed.
Non-Parametric Approaches
When assumptions about normal distribution fail, non-parametric methods step in.
- Wilcoxon signed-rank test instead of a paired t-test.
- Kruskal–Wallis test instead of ANOVA.
- Chi-square test for categorical data.
These methods expand the reliability of inferential statistics to real-world messy datasets.
Descriptive vs Inferential in Big Data
With big data, descriptive statistics are often automated dashboards (e.g., real-time KPIs in Tableau or Power BI).
But inferential methods face challenges:
- Scalability: Running ANOVA or regression on terabytes of data requires distributed computing frameworks.
- False Positives: Large datasets can make even trivial effects statistically significant.
Solution: Companies increasingly rely on statistical learning theory (e.g., regularization in regression) to avoid overfitting.
Integration with Machine Learning
Machine learning models often blend descriptive and inferential approaches.
- Descriptive: Feature importance ranking in decision trees.
- Inferential: Hypothesis testing on feature correlations to validate model inputs.
Advanced Visualizations
Beyond simple histograms and bar charts, advanced visualization techniques enhance descriptive statistics:
- Box plots with notches: Visual confidence intervals for medians.
- Violin plots: Show distribution density along with summary statistics.
- Heatmaps: Visualize correlation matrices.
These provide deeper insights that bridge descriptive and inferential perspectives.
Error Types in Inferential Statistics
Understanding Type I and Type II errors is essential for advanced inference.
- Type I Error: False positive (rejecting a true null hypothesis).
- Type II Error: False negative (failing to reject a false null).
Advanced Insight: Balancing these requires adjusting alpha (significance level) and considering statistical power (probability of detecting true effects).
Meta-Analysis in Inferential Statistics
Meta-analysis combines results from multiple studies to make more robust inferences.
- Uses weighted averages across studies.
- Corrects for publication bias.
Example: In medical research, meta-analysis combines results of dozens of clinical trials to determine whether a new therapy is truly effective.
Ethical and Practical Considerations
- Misuse of Descriptive Statistics: Cherry-picking averages without showing distribution.
- Misuse of Inferential Statistics: Over-reliance on p-values without context.
- Ethics in Data Science: Transparency in methods, reproducibility of results, and avoiding misleading conclusions.
Future of Statistical Methods in Data Science

With AI and big data, the role of both descriptive and inferential statistics is expanding. Automated machine learning (AutoML) platforms increasingly integrate these statistical foundations to improve model transparency and trustworthiness.
Conclusion
Understanding the balance between descriptive statistics vs inferential statistics is fundamental to data science. While descriptive methods allow us to summarize and visualize data, inferential methods let us make bold, reliable predictions beyond the available dataset.
Whether you’re a business analyst, researcher, or machine learning practitioner, mastering both branches of statistics equips you to transform data into meaningful insights.
FAQ’s
What is the difference between inferential and descriptive statistics?
Descriptive statistics summarize and present data using measures like mean, median, and charts, while inferential statistics draw conclusions or make predictions about a population based on a sample of data.
What is an example of an inferential statistic?
An example of an inferential statistic is using a sample survey of voters to predict the outcome of an entire election, where conclusions about the population are drawn from sample data.
What is an example of a descriptive statistic?
An example of a descriptive statistic is calculating the average test score of a class to summarize student performance without making predictions beyond that group.
What are two types of descriptive statistics?
The two types of descriptive statistics are measures of central tendency (mean, median, mode) and measures of variability (range, variance, standard deviation).
What are the two main types of statistics?
The two main types of statistics are Descriptive Statistics (summarizing and organizing data) and Inferential Statistics (making predictions or generalizations about a population from a sample).


