In today’s data-driven world, organizations collect vast amounts of data with numerous variables. While this high-dimensional data can contain valuable insights, it often becomes complex to analyze and visualize. Principal Component Analysis (PCA) is a powerful statistical technique used to simplify such datasets while preserving their core information.
PCA helps reduce the number of variables in your data (dimensionality reduction) while retaining the most important patterns. This makes it easier for analysts and machine learning models to interpret the data efficiently.
Why Principal Component Analysis is Important in Data Science
Data science projects often deal with hundreds or even thousands of features. High-dimensional data can cause:
- Computational inefficiency – Slower processing time.
- Overfitting – Too many variables increase model complexity.
- Difficulty in visualization – More than three dimensions are hard to plot.
By applying Principal Component Analysis, you can:
- Compress large datasets without losing significant accuracy.
- Improve machine learning model performance.
- Make data visualization possible in 2D or 3D.
How Principal Component Analysis Works – The Step-by-Step Process
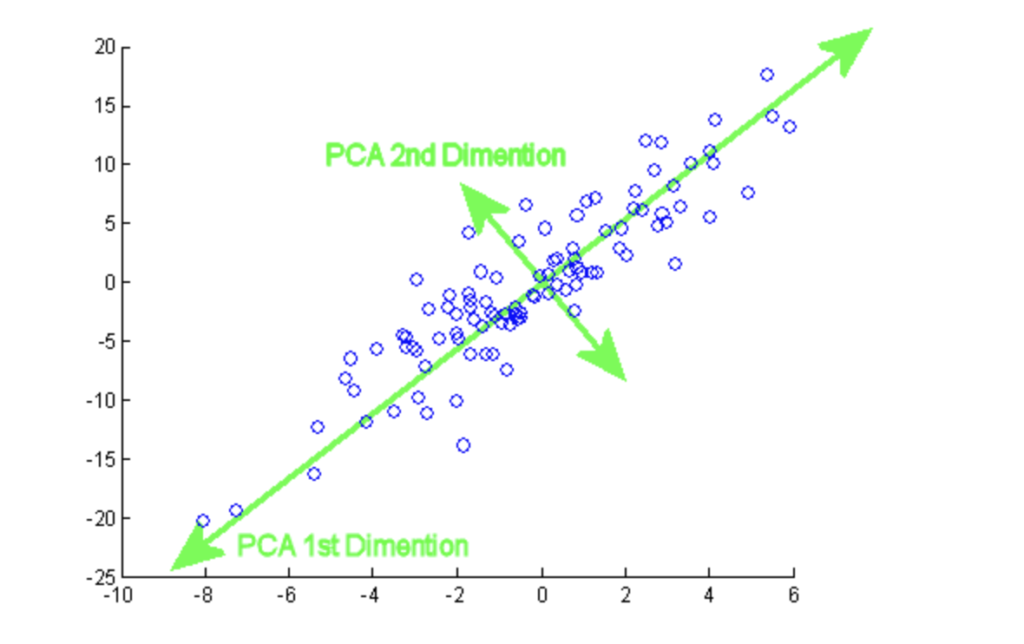
The PCA process involves mathematical transformations to identify the directions (principal components) where data variation is maximum.
Steps in PCA:
- Standardize the data – Ensure all variables have equal weight by normalizing them.
- Calculate the covariance matrix – Understand relationships between variables.
- Compute eigenvectors and eigenvalues – Identify directions of maximum variance.
- Sort components by explained variance – Keep the most important ones.
- Transform the dataset – Project original data onto the principal components.
Mathematical Intuition Behind Principal Component Analysis

The heart of PCA lies in linear algebra. Each principal component is a linear combination of the original variables.
- Covariance Matrix shows how variables change together.
- Eigenvectors determine the direction of principal components.
- Eigenvalues represent the magnitude of variance captured.
For instance, in a dataset with two variables — height and weight — PCA may find that most variation lies along a single line representing general body size.
Key Terminologies in PCA
- Principal Components – New variables created from original data.
- Explained Variance – Amount of information retained by each component.
- Dimensionality Reduction – Reducing features while preserving essential patterns.
- Loading Scores – Correlation between original variables and principal components.
Advantages of Using Principal Component Analysis
- Simplifies high-dimensional datasets.
- Reduces computation time for algorithms.
- Removes multicollinearity in data.
- Enhances visualization possibilities.
Limitations of Principal Component Analysis
- PCA is a linear technique – may not work well with non-linear relationships.
- Components are not easily interpretable.
- Sensitive to variable scaling.
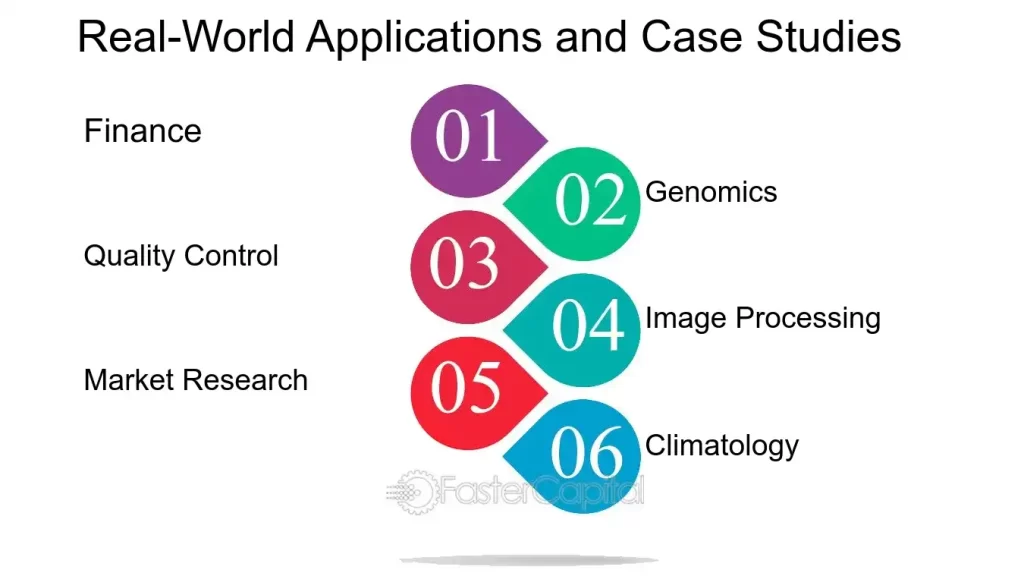
Real-World Applications of PCA

- Image Compression – Reducing image size without losing significant detail.
- Finance – Identifying main factors driving stock prices.
- Healthcare – Simplifying patient data for disease prediction.
- Marketing – Understanding customer segmentation.
Principal Component Analysis vs Other Dimensionality Reduction Techniques
| Feature | PCA | t-SNE | LDA |
| Approach | Linear | Non-linear | Supervised |
| Interpretability | Moderate | Low | High |
| Speed | High | Medium | Medium |
| Best Use Case | Large, linear datasets | Visualization | Classification |
PCA Implementation in Python (Step-by-Step)
import pandas as pd
from sklearn.decomposition import PCA
from sklearn.preprocessing import StandardScaler
# Load dataset
data = pd.read_csv("dataset.csv")
# Standardize the features
scaler = StandardScaler()
scaled_data = scaler.fit_transform(data)
# Apply PCA
pca = PCA(n_components=2)
pca_result = pca.fit_transform(scaled_data)
# Create a DataFrame
pca_df = pd.DataFrame(pca_result, columns=['PC1', 'PC2'])
print(pca.explained_variance_ratio_)
Explanation:
- Data is standardized to ensure fair comparison.
- PCA reduces the dataset to 2 components for visualization.
Best Practices for Using PCA Effectively
- Always standardize or normalize data before PCA.
- Use scree plots to decide the number of components.
- Interpret results in the context of domain knowledge.
- Combine PCA with machine learning models for efficiency.
Conclusion
Principal Component Analysis is a cornerstone of data science and analytics. By reducing dimensionality while preserving valuable insights, it allows for faster computations, improved model performance, and better visual understanding.Whether in finance, healthcare, or machine learning, PCA continues to be a go-to technique for transforming complex datasets into actionable insights.


