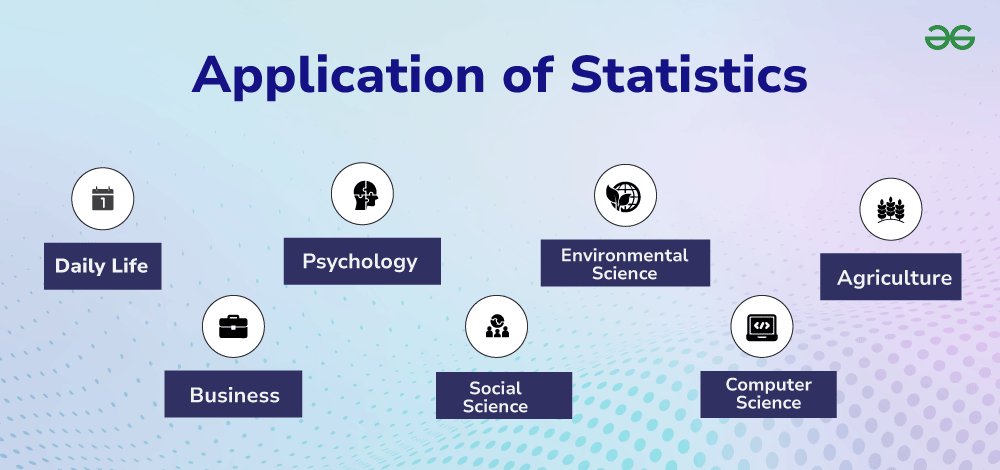
Data is everywhere — from business transactions, healthcare records, and social media interactions to sports performance and scientific experiments. Statistics fundamentals provide us with the tools to collect, analyze, interpret, and present data in a meaningful way.
Unlike mathematics, which is more abstract, statistics deals with real-world problems. For example, when businesses want to forecast next quarter’s sales or doctors test whether a new treatment is effective, statistics helps them make evidence-based decisions.
Why Learning Statistics Matters in Today’s World
- Data-Driven Decision Making – Every organization today relies on data. From small businesses to multinational corporations, decisions about marketing, operations, and strategy are backed by statistical analysis.
- Understanding Global Trends – Governments and international bodies use statistics to track population growth, unemployment rates, inflation, and health outcomes. For example, the World Health Organization (WHO) relies on statistics to monitor global disease outbreaks.
- Scientific Research Validation – Whether in medicine, psychology, or engineering, research findings are only accepted when backed by solid statistical evidence. Clinical trials, for example, are built entirely on statistical testing.
- Foundation for Artificial Intelligence & Machine Learning – Algorithms like regression, classification, clustering, and neural networks all stem from statistics fundamentals. Without statistics, AI models cannot be validated or trusted.
- Finance & Investment Decisions – Banks and investors use statistical models to forecast stock movements, assess risks, and optimize portfolios. For instance, Value at Risk (VaR) is a statistical technique to estimate potential investment losses.
- Everyday Applications – From polling results in elections to product ratings on Amazon, statistics influence what people read, buy, or vote for.
- Policy and Law Making – Governments depend on statistics for policy creation, such as determining poverty lines, setting tax brackets, or allocating resources for education and healthcare.
- Improved Critical Thinking – Knowing statistics helps individuals identify misinformation, spot biases in surveys or media, and make logical judgments rather than relying on assumptions.
Core Concepts in Statistics
Data Types
Statistics begins with data, which can be:
- Quantitative (Numerical): E.g., age, salary, height.
- Qualitative (Categorical): E.g., gender, country, color.
Population and Sample
- Population: The entire group (e.g., all university students).
- Sample: A subset of the population (e.g., 200 students surveyed).
Variables in Statistics
Variables can be independent, dependent, or controlled. For example, in a study measuring how sleep hours affect exam performance, sleep hours is the independent variable, while exam score is the dependent variable.
Descriptive Statistics
Descriptive statistics summarize and describe data.
Measures of Central Tendency
- Mean: Average of values.
- Median: Middle value in ordered data.
- Mode: Most frequent value.
Example: If students scored [60, 65, 70, 70, 80], the mean = 69, median = 70, and mode = 70.
Measures of Dispersion
- Range: Difference between highest and lowest values.
- Variance & Standard Deviation: Measure how spread out data is.
Data Visualization Techniques
Graphs like bar charts, histograms, and scatter plots are essential for identifying patterns.
Probability and Its Role in Statistics
Probability is the foundation of inferential statistics. It helps quantify uncertainty.
Example: When flipping a coin, the probability of getting heads is 0.5 (50%).
Applications:
- Weather forecasting
- Risk assessment in finance
- Predicting outcomes in machine learning
Inferential Statistics
Inferential statistics allow us to make predictions and conclusions about a population using sample data.
Hypothesis Testing
- Null Hypothesis (H0): No effect or difference.
- Alternative Hypothesis (H1): There is an effect or difference.
Confidence Intervals
A confidence interval gives a range where the true population value likely falls. For instance, “We are 95% confident that the average height of students lies between 165–170 cm.”
Chi-Square, T-Test, and ANOVA
- Chi-Square Test: For categorical data (e.g., gender vs. purchase preference).
- T-Test: Compares means between two groups.
- ANOVA: Compares means across more than two groups.
Real-World Applications of Statistics Fundamentals

- Healthcare: Testing effectiveness of drugs.
- Business: Customer segmentation and market analysis.
- Sports: Measuring player performance and predicting outcomes.
- Education: Analyzing student test scores for curriculum improvement.
- Social Media: Measuring engagement rates and ad effectiveness.
Statistics in Data Science and Machine Learning
Without statistics fundamentals, machine learning models cannot be built effectively.
- Regression analysis predicts continuous outcomes.
- Classification models use probability concepts.
- Sampling and hypothesis testing ensure model reliability.
- Data Collection & Sampling – Ensures the data used for building models is representative of the real-world population, reducing biases.
- Data Cleaning & Preprocessing – Statistical methods help handle missing values, detect outliers, and normalize datasets before feeding them into models.
- Exploratory Data Analysis (EDA) – Techniques like mean, median, standard deviation, and correlation are used to uncover hidden patterns in raw data.
- Feature Selection & Engineering – Statistical tests such as chi-square, ANOVA, and correlation help identify the most impactful features for machine learning models.
- Model Building & Validation – Statistics provides probability theory and distribution functions, which form the backbone of algorithms like regression, Naïve Bayes, and logistic regression.
- Hypothesis Testing – Validates assumptions in experiments, such as A/B testing for product improvements or feature updates.
- Performance Evaluation – Metrics like Mean Squared Error (MSE), R² score, precision, recall, and F1-score are all derived from statistical concepts.
- Uncertainty & Probabilistic Models – Algorithms like Hidden Markov Models, Bayesian networks, and probabilistic graphical models heavily depend on statistical reasoning.
- AI & Predictive Analytics – Statistics is the backbone of predictive modeling, time-series forecasting, and anomaly detection in real-world AI systems.
Common Mistakes to Avoid in Statistics
- Using too small a sample size.
- Confusing correlation with causation.
- Ignoring outliers.
- Misinterpreting p-values.
Best Tools and Resources to Learn Statistics

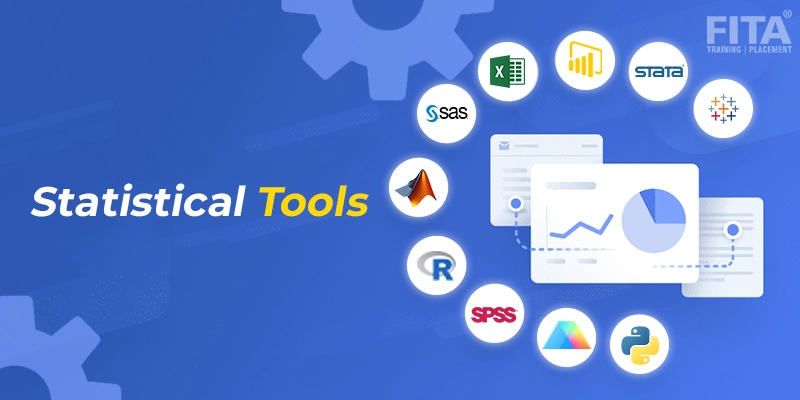
- Excel & Google Sheets (for beginners).
- R and Python (for advanced learners).
- Online platforms: Khan Academy, Analytics Vidhya, and Coursera.
Conclusion
Understanding statistics fundamentals is not just for students or researchers — it’s a life skill in today’s digital era. From analyzing business data to training AI systems, statistics empowers us to make decisions with confidence.By mastering both descriptive and inferential techniques, you gain the ability to see beyond raw numbers and uncover meaningful insights that can transform outcomes in business, science, and everyday life.


