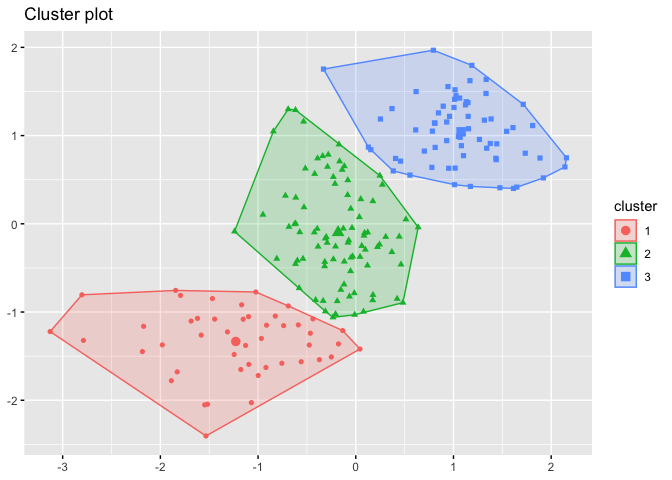
Data is everywhere, but the challenge lies in finding hidden patterns and meaningful insights. This is where cluster analysis in R becomes invaluable.
Cluster analysis is an unsupervised learning technique used to group similar objects into clusters without prior labels. With R programming, a powerful tool for statistical computing, performing clustering becomes easier, faster, and highly customizable.
What is Cluster Analysis?
Cluster analysis is a method of grouping data objects based on their similarity. For example, a retailer may want to segment customers based on purchasing behavior. Clustering can automatically identify groups such as high-value customers, occasional buyers, and new customers.
Why Use Cluster Analysis in R?
R is one of the most popular languages for data science and statistical modeling. Advantages include:
- Availability of powerful clustering packages like stats, cluster, factoextra, dbscan.
- Easy visualization with ggplot2.
- Open-source and widely supported by the community.
- Flexibility to integrate clustering with machine learning pipelines.
Types of Clustering Techniques
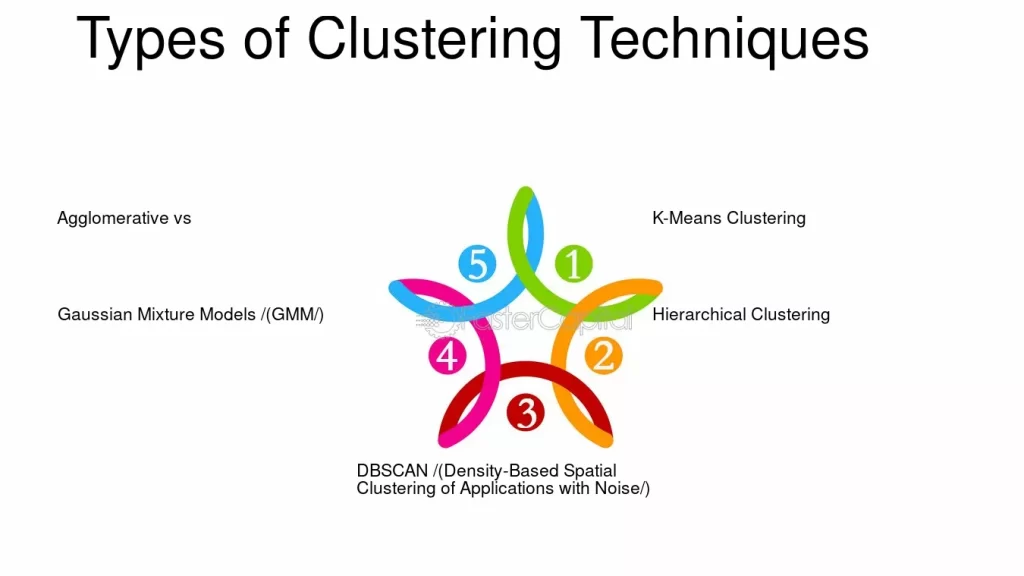
- Hierarchical Clustering
- Creates a dendrogram (tree structure).
- Merges or splits clusters step-by-step.
- Example use case: Document classification.
- Creates a dendrogram (tree structure).
- K-Means Clustering
- Groups data into K clusters.
- Works well for numerical data.
- Example: Customer segmentation.
- Groups data into K clusters.
- Model-Based Clustering
- Assumes data is generated from a mixture of underlying distributions.
- Uses probabilistic models.
- Assumes data is generated from a mixture of underlying distributions.
- Density-Based Clustering (DBSCAN)
- Finds clusters of arbitrary shape.
- Identifies outliers effectively.
- Example: Fraud detection.
- Finds clusters of arbitrary shape.
Key Concepts in Cluster Analysis in R
- Distance Measures: Euclidean, Manhattan, Cosine similarity.
- Cluster Centroid: Average position of all points in a cluster.
- Within-Cluster Variance: Measures compactness of clusters.
- Between-Cluster Variance: Measures separation between clusters.
Real-Time Applications of Cluster Analysis in R
- Retail: Market basket analysis, customer segmentation.
- Healthcare: Grouping patients with similar symptoms.
- Banking: Detecting fraudulent activities.
- Marketing: Identifying target audiences for campaigns.
- Social Media: Community detection in networks.
Step-by-Step Guide: Performing Cluster Analysis in R
a. Data Preparation
data <- iris[, -5] # Removing species column
head(data)
b. K-Means Clustering in R
set.seed(123)
kmeans_result <- kmeans(data, centers=3, nstart=25)
print(kmeans_result$cluster)
c. Visualizing Clusters
library(ggplot2)
ggplot(iris, aes(Petal.Length, Petal.Width, color=factor(kmeans_result$cluster))) +
geom_point(size=3)
d. Hierarchical Clustering
dist_matrix <- dist(data)
hc <- hclust(dist_matrix, method="complete")
plot(hc)
Evaluation of Clusters
- Silhouette Score: Measures quality of clusters.
- Elbow Method: Identifies optimal number of clusters.
- Dunn Index: Evaluates separation and compactness.
library(cluster)
sil <- silhouette(kmeans_result$cluster, dist(data))
plot(sil)
Advantages of Cluster Analysis in R
- Handles large datasets efficiently.
- Provides unsupervised insights without labels.
- Highly flexible with visualizations and statistical methods.
- Works for both categorical and numerical data.
Limitations and Challenges
- Choosing the right number of clusters can be tricky.
- Sensitive to outliers and noise.
- Results may vary with different initializations.
- Not always interpretable in complex datasets.
Cluster Analysis vs Classification
| Feature | Cluster Analysis in R | Classification in R |
| Learning Type | Unsupervised | Supervised |
| Labels Required | No | Yes |
| Examples | Market segmentation | Spam detection |
Case Studies of Cluster Analysis in R
- Customer Segmentation: An e-commerce company uses clustering in R to group customers and personalize recommendations.
- Healthcare: Hospitals group patients by disease progression to optimize treatment plans.
- Social Media: Twitter communities are clustered to identify influencers.
Tools and R Packages for Cluster Analysis
- stats – Base R clustering functions.
- cluster – Advanced clustering algorithms.
- factoextra – Easy cluster visualization.
- dbscan – Density-based clustering.
- caret – Machine learning workflows.
Mathematical Foundations of Cluster Analysis in R
While clustering often appears as a simple grouping of similar objects, the underlying mathematics is more nuanced. Understanding the math helps in selecting the right algorithms and interpreting results.
a. Distance Measures
Clustering relies heavily on distance metrics to define similarity between data points. In R, common measures include:

- Mahalanobis Distance: Takes correlation between variables into account.
In R:
dist_matrix <- dist(data, method = "euclidean")
b. Objective Function of K-Means

Where:
- Ck = cluster k
- μk = centroid of cluster k
This means the algorithm iteratively updates centroids until total variance is minimized.
c. Hierarchical Clustering Mathematics
- Agglomerative (Bottom-up): Start with individual points and merge step by step.
- Divisive (Top-down): Start with one cluster and split recursively.
Linkage criteria in R:
- Single linkage: Minimum distance between clusters.
- Complete linkage: Maximum distance between clusters.
- Average linkage: Mean distance between clusters.
Advanced Clustering Algorithms in R
Beyond K-means and hierarchical clustering, advanced algorithms expand clustering capabilities.
a. Gaussian Mixture Models (GMM)
- Probabilistic clustering.
- Each cluster is modeled as a Gaussian distribution.
- Uses Expectation-Maximization (EM).
- R Package: mclust.
library(mclust)
gmm_model <- Mclust(data)
summary(gmm_model)
b. DBSCAN (Density-Based Spatial Clustering of Applications with Noise)
- Works well for clusters of arbitrary shape.
- Identifies noise/outliers.
- Parameters: eps (neighborhood size), minPts (minimum points).
library(dbscan)
db_model <- dbscan(data, eps=0.5, minPts=5)
plot(db_model, data)
c. Spectral Clustering
- Uses graph theory and eigenvalues of similarity matrices.
- Good for non-convex clusters.
- R package: kernlab.
d. Self-Organizing Maps (SOM)
- Neural network approach to clustering.
- Useful for high-dimensional data.
- R package: kohonen.
Cluster Validation Techniques
Choosing the right number of clusters is one of the hardest tasks in cluster analysis.
a. Internal Validation
- Silhouette Score
- Davies-Bouldin Index
- Calinski-Harabasz Index
b. External Validation
If true labels are available:
- Rand Index
- Adjusted Mutual Information (AMI)
c. Stability Validation
- Tests whether clusters remain consistent across subsets.
Feature Engineering for Cluster Analysis in R
a. Scaling and Normalization
- Clustering is sensitive to scale.
- Always standardize numerical data before clustering.
scaled_data <- scale(data)
b. Dimensionality Reduction
- Principal Component Analysis (PCA): Reduce noise and compress data.
- t-SNE: Non-linear dimensionality reduction for visualization.
pca <- prcomp(data, scale. = TRUE)
plot(pca$x[,1:2])
Real-World Case Study: Customer Segmentation in R
A retail company wants to segment customers for personalized marketing.
Steps in R:
- Load data (purchase history).
- Preprocess (normalize features).
- Apply K-means with k=3.
- Evaluate with Silhouette score.
- Visualize with ggplot2.
set.seed(42)
kmeans_result <- kmeans(scaled_data, centers=3, nstart=20)
fviz_cluster(kmeans_result, data=scaled_data)
Insights:
- Cluster 1: High-value frequent buyers.
- Cluster 2: Price-sensitive occasional buyers.
- Cluster 3: New customers.
This helps the retailer design targeted campaigns.
Big Data and Cluster Analysis in R
When data is massive, traditional clustering fails. Solutions:
- Mini-Batch K-Means: Processes data in chunks.
- Parallel Computing in R: Use parallel or foreach package.
- Integration with Spark (SparkR): Distributed clustering.
Ensemble Clustering in R
While single clustering algorithms provide results based on one perspective, ensemble clustering combines multiple clustering solutions to achieve more robust and stable results. This approach is especially useful when datasets are noisy, complex, or high-dimensional.
How it Works
- Generate multiple clustering results using different algorithms (K-means, DBSCAN, GMM).
- Combine them through consensus functions such as co-association matrices or voting schemes.
- The final result represents a consensus of several methods, reducing algorithm-specific biases.
R Implementation
The clue package in R provides functions for clustering ensembles.
library(clue)
cl1 <- kmeans(scale(data), centers=3)
cl2 <- pam(scale(data), k=3)
cl3 <- clara(scale(data), k=3)
ensemble <- cl_ensemble(list(cl1, cl2, cl3))
cl_consensus(ensemble)
Bayesian Clustering in R
Traditional clustering methods assign points to clusters deterministically. Bayesian clustering introduces probability distributions, allowing uncertainty modeling in cluster memberships.
- Uses Dirichlet Process Mixture Models (DPMM) to automatically infer the number of clusters.
- Helpful when the true number of clusters is unknown or data is non-Gaussian.
- Implemented via the dirichletprocess R package.
library(dirichletprocess)
dp <- DirichletProcessGaussian(data)
dp <- Fit(dp, 1000)
plot(dp)
Advanced Visualization of Clusters in R
- Dendrograms (Hierarchical Clustering)
- 2D Cluster Plots (ggplot2 + factoextra)
- 3D Plots (plotly)
library(factoextra)
fviz_cluster(kmeans_result, data = scaled_data, geom = "point")
Ethical Considerations in Cluster Analysis
- Bias in clustering: If features are biased, clusters may reinforce stereotypes.
- Data privacy: Clustering personal data (like healthcare or banking) must comply with regulations (GDPR, HIPAA).
- Interpretability: Misinterpretation of clusters can lead to wrong business decisions.
Future of Cluster Analysis in R
- Hybrid Approaches: Combining supervised + unsupervised learning.
- Deep Clustering: Neural networks + clustering (e.g., autoencoders + k-means).
- Explainable Clustering: Using SHAP values for cluster interpretability.
- Streaming Data Clustering: Real-time clustering for IoT and online applications.
- Integration with deep learning (autoencoders for clustering).
- Explainable AI for cluster interpretability.
- Big data clustering with distributed computing in R.
- Hybrid clustering methods combining supervised + unsupervised learning.
Conclusion
The cluster analysis in R is a cornerstone of unsupervised learning, enabling data scientists to discover hidden patterns without prior knowledge. From healthcare to retail, its applications are transforming decision-making.
By leveraging R’s powerful statistical libraries, businesses and researchers can perform clustering more efficiently, visualize insights, and create actionable strategies.
The advanced techniques of cluster analysis in R extend beyond basic K-means and hierarchical clustering. By leveraging mathematical models, probabilistic approaches, density-based algorithms, and neural-inspired methods like SOM, R enables data scientists to explore clustering at scale.
Moreover, combining clustering with dimensionality reduction, feature engineering, and big data tools enhances accuracy and efficiency. Whether you are segmenting customers, detecting fraud, or analyzing medical data, R provides a robust ecosystem to tackle complex clustering problems.
FAQ’s
What is cluster analysis?
Cluster analysis is an unsupervised learning technique used to group similar data points into clusters based on their characteristics, helping uncover hidden patterns and structures in datasets.
Why use R for cluster analysis?
R is widely used for cluster analysis because it offers powerful statistical libraries, visualization tools, and built-in clustering algorithms like k-means, hierarchical, and DBSCAN, making it ideal for data exploration and pattern discovery.
What are the main types of clustering algorithms in R?
The main types of clustering algorithms in R include K-means clustering, Hierarchical clustering, DBSCAN (Density-Based), and Model-based clustering (e.g., Gaussian Mixture Models).
How do I prepare data for cluster analysis in R?
To prepare data for cluster analysis in R, you need to clean missing values, scale/normalize numerical variables, encode categorical data if needed, and remove outliers, ensuring all features are on a comparable scale for accurate clustering.
How do I evaluate the quality of a clustering solution?
You can evaluate clustering quality using metrics like Silhouette Score, Davies-Bouldin Index, and Within-Cluster Sum of Squares (WCSS), which assess how well data points fit within their clusters and how distinct the clusters are from each other.
